What is Data Visualization and Why is it Important?
Data visualization is the process of transforming data into graphical representations that helps us understand data more effectively. It allows us to understand outliers, patterns and trends in data at a faster pace. Strong data visualization helps people and enterprises analyze their data more efficiently to gain valuable insights and results in more informed decision-making.
Data visualization tools make this process accessible to all of us and makes the complicated task of breaking down big data a lot easier.
What are the Types of Data Visualization?
There are many different ways to visualize data. From bar charts, pie charts, scatter plots to maps, histograms… There are so many ways to look at data! Check out other data visualization examples here and here.
Whilst there are so many types of data visualization, it is important to think about what is the best way to represent the data at hand.
How to Visualize Data with Unfolded Studio and FME?
What is Unfolded Studio?
Unfolded Studio is a geospatial data visualization tool that was created by Unfolded, which was acquired by Foursquare in 2021. Sophisticated yet highly intuitive, Unfolded Studio allows users to create stunning, insightful maps and data visualizations in minutes.
Safe Software used the Unfolded data’s software development kit (SDK) in Unfolded Studio and realized there was an opportunity with FME. As you all know, everyone at Safe Software loves anything to do with spatial data. Hence, Safe Software used the Unfolded Data SDK to create an FME Unfolded Reader Writer. Our goal in creating this new reader writer was to enable users of Unfolded Studio to easily connect, transform and automate Unfolded data using FME – the most comprehensive data integration tool for spatial data. It was a partnership that came together naturally.
FME 2022.0: What is the Unfolded Reader/Writer?
The Unfolded Reader/Writer is a FME Format that allows Unfolded users who can access FME to transform, merge, clean up and separate data via FME. This is a feature that will be released in the FME 2022.0 launch later this year. Workflows can be automated in FME Server, to run and update at a custom frequency. This feature can be found in FME hub and workbench.
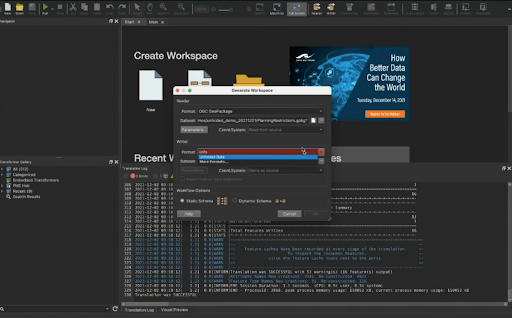
Unfolded Reader Writer in FME Workbench
Unfolded was built on top of popular open-source spatial indexing libraries that its founders, a group of ex-Uber geospatial engineers, had created. Based on this model, applications built on these libraries can process and visualize geospatial data sets. This intrigued all of us at Safe Software. With our comprehensive understanding of spatial data, we previously built connectors similar to this and decided to build the Unfolded Reader Writer.
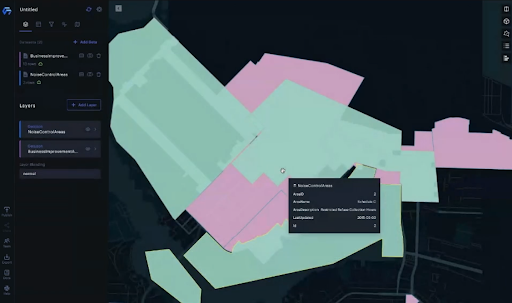
FME Users visualizing data on Unfolded Studio
FME Users who use Unfolded Data can also make UI rich maps of data, use Unfolded Studio as a further tool for spatial data unification (Unfolded has hexagon-based indexing), and a rapid data exploration tool to filter, aggregate, and playback large datasets directly in your browser. This partnership goes both ways and allows data to be visualized the best way possible.
The Reader function can be used for CSV, Shapefiles, GeoJSON, JSON files, or other datasets created through FME. The Writer function creates new Unfolded datasets or replaces contents of existing dataset.
Benefits of Unfolded Reader Writer
For example, Unfolded Data is used for retail businesses to gather consumer behaviour, gathered from cell phone data. Connecting to FME can help frequently automate the data transformation of shopper’s cell phones, giving recent insights in the form of high-quality data visualizations.
This is useful for any brick-and-mortar retail store looking to analyze their foot traffic. This could be clothing, housewares, electronics, anything with a physical presence including telecommunications for consumers, restaurant chains, etc. In-person visits to retail stores became even more important to the industry during the pandemic, since shopper habits changed drastically. Data about in-person visits follows new trends. As the shoppers change, the FME Unfolded Reader Writer and Unfolded Studio can identify new shopper demographics with different needs from Unfolded data. This up-to-date data is valuable to businesses looking to expand and maintain their market. This helps retailers adjust their messaging and branding, test results and iterate. Sales campaigns and in-person advertisement efficacy can be tracked, tested and improved.
Why is this the Best Way to Visualize Data?
As mentioned above, using both Unfolded Studio and FME as data visualization tools produces high-quality data visualizations, and perhaps the best data visualization.
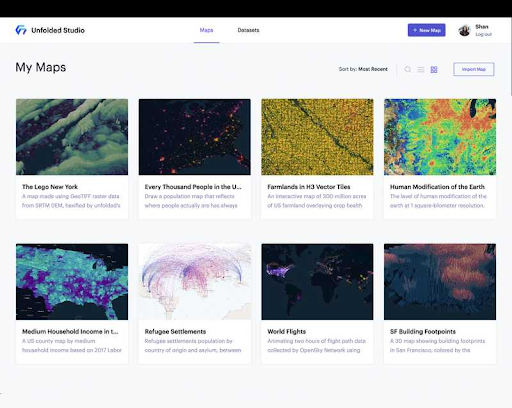
Types of data visualization available on Unfolded Studio – there are so many ways to visualize data!
Using FME without the Unfolded Reader/Writer presents challenges. The alternative to using Unfolded Reader/Writer in FME would be using HTTP caller, downloading dataset, and passing results to Feature Reader. Another alternative would be developers external to Safe making their own custom connection to FME from Unfolded SDK (only few partners have tried to date). The bottom line is that it takes more time and resources than using a ready-made Unfolded Reader Writer to visualize your data.
Our solution is richer and offers a better UI. Our solution is also faster and cheaper. This is why it’s the best way to visualize data.
Making the Most out of Unfolded Reader/Writer in Unfolded Studio and FME
The Unfolded Reader/Writer focuses on allowing users to access datasets which an Unfolded Data user owns. This is a great tool for data visualization to filter, aggregate, and playback large datasets directly in your browser, especially for spatial data.
Whilst Unfolded Studio is the developer platform where developers can access their SDK to know and develop with their API, you can also visualize data on Unfolded Platform too. The FME Reader Writer with Unfolded technologies.
The Unfolded Studio is great for FME Users who want to customize their workflow and access you can explore the Unfolded Platform too.
To recap, FME’s Unfolded Reader Writer is our pre-built connection to Unfolded. We built this using the Unfolded API in Unfolded Studio. With our Reader Writer, a user just needs to know how to use FME to read and write information to and from Unfolded, and can transform that information in FME between reading and writing it. This means that users don’t need to be a developer to tap into the power of Unfolded’s API, and to customize the information (data) from it. Both tools, when used together, are powerful tools for data visualization!
We are excited to release this feature. Stay tuned or sign up for our newsletter for more updates, especially as we get closer to releasing FME 2022.0!

Nicole Lee