Linear referencing is a helpful spatial reference method for professionals who work with linear data, like roads, pipelines, power lines, railways, and any other infrastructure that’s represented as lines and polylines in GIS. It’s popular because it stores data in an intuitive way for linear features, which facilitates analysis, insight, and data management.
In this post, we’ll discuss what linear referencing is, examples of it in practice, and how to get started with a Linear Referencing System (LRS).
What is Linear Referencing?
Linear referencing is a method of storing assets and characteristics using their relative positions along a line. Think of it like an addressing system, or a spatial reference system that uses measurements instead of absolute coordinates. For example, road sign locations can be defined by where they’re located using a mile marker rather than by their x/y coordinates.
To use proper terminology, linear referencing uses measures to locate events along a route. For example, the “Hwy 6” sign in the image below (a point event) is an asset that’s located at measure 2.1 km along the route. The fence (a line event) starts at measure 2.0 km and continues for 0.8 km. The events that occur along the route are stored in an event table.
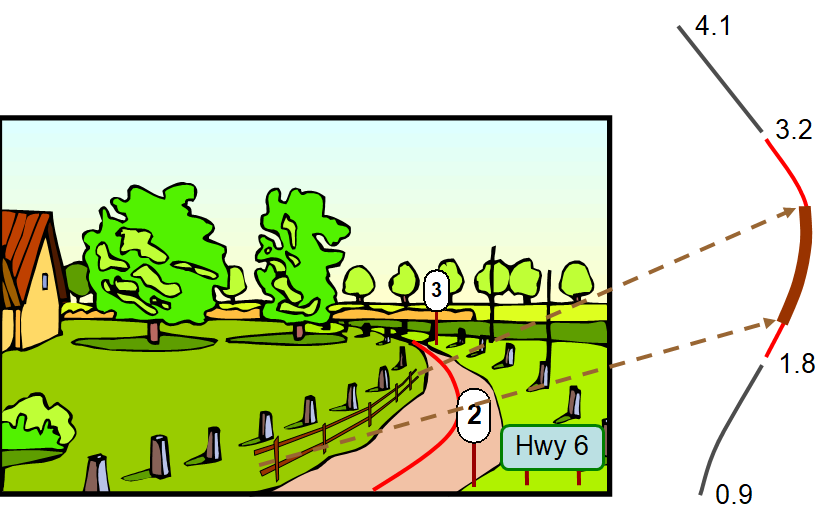
Point and line events are defined in terms of where they fall along the road network. For example, in this image, the fence is referenced to Hwy 6 from 2.0 km to 2.8 km.
A useful feature of linear referencing is that we can assign different attributes or characteristics to segments of a line. For example, a road feature could have an event from measure 0 to 5 where the speed limit is 60 km/h, and then from 5 to 9 where the speed limit is 70 km/h, and then from 9 to 10 where the speed limit is 60 km/h. Linear referencing enables us to store the different speed attributes as events in reference to the road line, rather than storing these as a set of distinct line segments.
With linear referencing, road segments with different attributes can be stored as events along the route. For example, this bar graph shows attributes like “speed” with different values along each section of the road.
Some of the terminology varies across industries—for example, linear referencing can also be referred to as stationing when talking about pipelines, or river addressing when talking about hydrology—but the principles of locating assets and characteristics along linear features are the same.
When is LRS useful?
With the ability to easily manage the characteristics of linear features and related assets, LRS is popular across industries that work with linear infrastructure. It’s especially helpful for asset management, including signs or mile markers along a road/railway, real-time movement of transit or freight, seismic data for oil and gas, and a range of other features represented in infrastructure datasets. The convenience comes from storing relative positions instead of absolute positions.
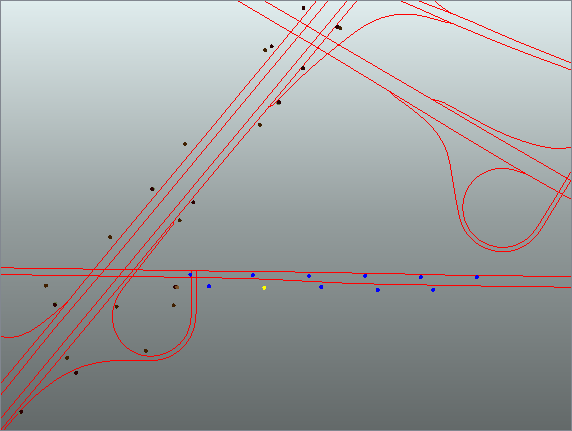
This LRS road network has sign assets represented as points.
LRS is helpful for coordinating projects because it provides a common database for everyone to use. Professionals can store one version of the linear geometry and reference all data to it, rather than store the data as many segmented features.
Real-World Examples
Here are a few examples of companies who use linear referencing for infrastructure:
- Transportation: GIM in Belgium created a road reference network by integrating two different data sources and storing the attributes using linear referencing.
- Utilities: Global Information Systems used linear referencing (stationing) to manage and maintain pipeline GIS models.
- Transportation: Esri migrated the Idaho Transportation Department to a new linear referencing system for locating snow plows in a road network.
- Transportation: Norwegian Public Roads Administration uses linear referencing to manage road networks, including placing signs for wildlife crossing.
- Energy: Willbros Engineering uses dynamic segmentation to store, process, and display information about oil and gas pipelines.
These are just a few examples. Most companies that work with infrastructure data have come across the need for linear referencing.
How to Get Started with Linear Referencing Workflows
When working with linear referencing, it’s important to be able to easily convert between a segmented model of the data and a linear referencing system with routes and events. This is achieved using a repeatable, automated FME workflow that includes built-in functionality like Measure* transformers and other specialized LRS transformers.
Watch our webinar recording, “Linear Referencing (LRS): How FME Measures Up”, to see demos of common LRS workflows, including how to use FME to integrate datasets, automate data delivery, and ensure data quality. The built-in tools for measures, events, and routes make it possible to perform common tasks like:
- Create a route and measures
- Create event tables from segmented geometry
- Locate assets/events along the route
- Manage events when the route changes (back/ahead measures)
- Ensure linear features are oriented correctly (cardinal orientation)
- Geocode assets to convert location descriptions into line geometries
- Create straight line diagrams
Download FME to get started with linear referencing, and check out the community for tutorials, Q&A, and more.
You might also want to read:
Streamlined Infrastructure Data Distribution Using the MMCD Standard & FME

Tiana Warner
Tiana is a Senior Marketing Specialist at Safe Software. Her background in computer programming and creative hobbies led her to be one of the main producers of creative content for Safe Software. Tiana spends her free time writing fantasy novels, riding her horse, and exploring nature with her rescue pup, Joey.