They say “spatial is special” and to me it really is. It has so many uses, is important in so many ways, and I don’t regret for a second making spatial data my career.
But spatial is special in another way: it’s a field that generates a huge amount of terminology and acronyms! This raises the bar to entry for spatial novices. In fact, there’s a common notion that it’s near impossible to explain your work to your family. It’s just too obscure and tortuous.
So I’m here today to help out; to cover some of the most common acronyms and explain the little nuances that help you to hold your own in a conversation.
I’ve split the article into different sections: systems, formats, technology, and geometry.
Systems
GIS
GIS is the abbreviation for geographic information system. It’s perhaps the term hardest to define because so many people use spatial (geographic) data (information) in so many different ways. Essentially, it’s software (a system) for processing spatial data. But that covers a lot of ground, so let’s see how else GIS can be defined.
On one episode of the podcast, Endless Threads, the presenter wanted to find the location where a viral photo had been taken. To do this, they explained:
“I used something called GIS, Geographic Information System. It’s a kind of data and mapping technology used around the world to organize information of all kinds for map-related stuff: urban planning, land rights, ownership.”
So there are two key parts to GIS there: storing spatial data and producing an output. Usually, the output is a map, but it doesn’t have to be. You could equally start with spatial data and transform it into a table of results.
The third key part of a GIS is analyzing data. Generally, you are looking for spatial relationships between objects. For example, a GIS can easily handle the known parameters of the viral photo:
- The photo was taken within 2-3 hours, of Austintown, OH
- There was a nearby campground with a swimming pool
- There were train tracks in the vicinity
- There was a small town nearby, with a school located next to a cemetery
OK, tracking down the location of a viral photo is not your usual use for GIS, but as was mentioned on the podcast, the same task could equally be required by someone locating sites of illegal dumping, so it’s not too strange.
So, any software with those key abilities (storing and analyzing spatial data to produce an output) could be considered a GIS. This ranges from basic tools like Google Earth, through to traditional GIS packages like ArcGIS and QGIS.
CAD
CAD means computer aided (or assisted) design. You might think CAD is not really spatial, but it lives at the intersection of architecture, engineering, and construction (AEC) and all of those fields often use spatial data. Buildings and bridges, for example, definitely have a location.
Data is often transferred between CAD and GIS software; usually from CAD to GIS to take the basic parts of a design (like the building outline) for use in spatial analysis.
Strongly related to CAD is building information modelling (BIM). BIM is usually a 3D representation of a building used to analyze its construction and operation. For example, it might be used to analyze the energy efficiency of a proposed building. As you can imagine, data passes back and forth between GIS, CAD, and BIM systems, because they all use related components.
Formats
Spatial is also special in propagating a staggering array of data formats.
There are many spatial formats and most (if not all of them) have an acronym. Sometimes it’s a standard acronym simply prefixed with “Geo”, for example GeoRSS, GeoJSON, and GeoTIFF, whereas other formats are their own acronym.
Some formats are defined and maintained by corporate entities, some by governments, while others are controlled by open standards groups like the Open Geospatial Consortium (OGC). Some spatial formats are a complete surprise (did you know that PDF can store 2D and 3D spatial vectors?!)
So how many spatial data formats are there? Well, I don’t think 500+ is an exaggeration, and that large number of options can, of course, lead to problems. The French president once asked, “How can you govern a country which has two hundred and forty-six varieties of cheese?” You might equally ask, “How can you manage a data type that has 500 different formats?”
Personally, I always turn to FME, a tool that supports most of these formats, and one that many use to integrate and transform their GIS and CAD data.
But going back to the formats, perhaps I should focus on a few of the most important ones…
SHP
While not a true acronym – SHP is an abbreviation for shapefile – it needs to be mentioned because it’s certainly the most-used format and that makes it very important.
Developed and maintained by Esri, one of the major names in the GIS world, shapefiles are used for storing vector data for maps (aka. points, lines, and polygons). Most people will encounter shapefiles because they are so ubiquitous in the spatial field, as a result of being an early, and open, format.
However, the shapefile format has its flaws. Its geometry support is limited, its database is rudimentary, its 3D support is minimal, and each dataset consists of multiple files. It polarizes users to such an extent that there are even websites dedicated to its demise.
For all that, it keeps on going because the format is good enough for most spatial uses, is supported by most software, and has the ability to integrate easily with other data.
GML
GML is the geographic equivalent of XML. As you might know, ML means “markup language” meaning that XML is a language that allows you to add structure to information, by marking it with tags. A specific set of tags is called a schema.
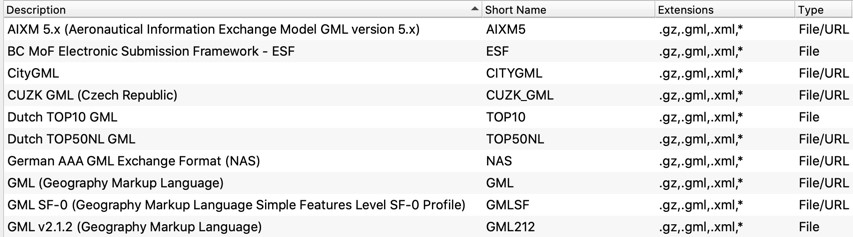
So, GML means geographic markup language. GML can represent spatial data in a general way, or use a specific schema. A schema is pretty much equivalent to a format, so GML underpins various other formats like AIXM, ESF, CityGML, and more.
IMDF
IMDF stands for indoor mapping data format. Similar to XML and GML, IMDF has a “parent” called JSON and is stored using the extension .geojson.
It’s important because indoor mapping, though still in its infancy, is widely considered to be the next up-and-coming technology. If you want to enable customers to navigate through your large buildings (such as airports, universities, or shopping malls) then indoor mapping is vital and you’ll most likely need to submit your spatial data to service providers in IMDF format.
Technology
GPS
You’re probably aware of GPS (Global Positioning System) but did you know that – like Hoover, Biro, and Jacuzzi – it’s a specific product and not the generic term for the technology? The actual name you should be using is GNSS, which means global navigation satellite system.
GPS, operated by the US, was the first GNSS, but is not the only available system. There is also Galileo (Europe), GLONASS (Russia), and BeiDou (China). Japan and India too have systems, although they are regional (RNSS) and not global.
What’s interesting is that receivers – such as your phone – can use multiple systems to calculate their position. So, even if you refer to “the GPS in your phone”, it could be using GLONASS instead, or a mixture of the two systems! The advantage is that by using multiple satellite systems, you can get a more reliable signal and quicker location.
Additionally, because it’s the same receiver, data coming from two separate GNSS should be available in the same format. The receiver won’t return a different format for data from GPS compared to GLONASS. The most common format is (sorry, another acronym coming up) GPX, which is the GPS exchange format.
LiDAR
You will likely know about RADAR and SONAR, where the RA part means RAdio, and the SO part means SOund. Like those other technologies, LiDAR is a type of scanner that builds a 3D picture of the world around it, but instead of radio or sound waves, it uses light. Thus, LiDAR stands for light detection and ranging.
Have you ever used LiDAR? Well, you might have, without even realizing it! LiDAR is built into many modern products. Driver assistance in cars is often powered by LiDAR scans, and so might your robot vacuum cleaner. LiDAR is now even being added to the latest phones that lets you do stuff like this:
If you wonder what difference #LiDAR makes for #AugmentedReality, @FMELizard explains it in this 5-second video. The left side is made with #iphoneXR, the right side – with #ipadpro, which makes this perfect occlusion. pic.twitter.com/SyYEbgk4dB
— Dmitri Bagh (@DmitriAtSafe) February 24, 2021
LiDAR scans of geographic areas are captured either from an aircraft, drone, or a ground vehicle, and – before processing – would look like this:

Coordinates & Geometry
LL or LAT-LONG
Although you might see the acronym LL written down, the spatial community would pronounce it as “lat long” anyway (not “ell-ell”). Yes, it refers to latitude and longitude, a way for geography to be represented by coordinates. A list of cities with their LL coordinates looks like this:
| City | Latitude | Longitude |
| Tokyo | 35.6897 | 139.6922 |
| Mexico City | 19.4333 | -99.1333 |
| Beijing | 39.9050 | 116.3914 |
| Moscow | 55.7558 | 37.6178 |
| Paris | 48.8566 | 2.3522 |
| London | 51.5072 | -0.1275 |
Where it becomes weird is that although we say “lat-long”, we usually display the coordinates as longitude-latitude in most software:
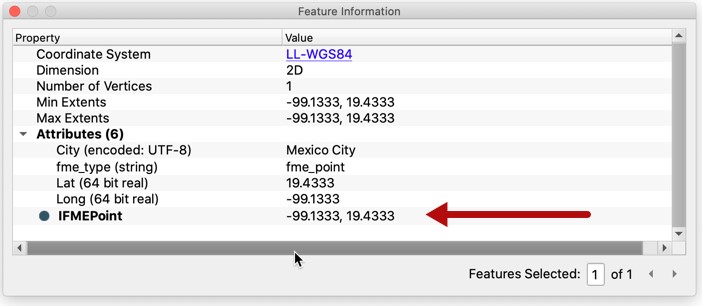
Why? Because spatial data is usually stored with the x axis before the y axis, and longitude is the x axis. But you have to check because not everyone works that way! So why not standardize on one or the other? Well, that’s like asking a British person whether to pour the tea before adding the milk! It’s not an argument you want to get into!
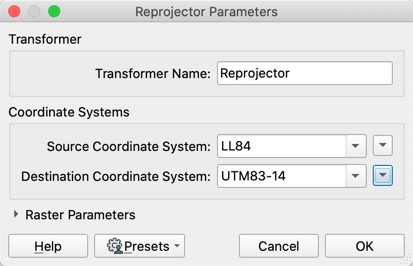
UTM
Besides LL, coordinates can be stored using other systems. For the full background, you can read through our existing blog on coordinate systems. One coordinate system of note is called UTM.
- U = Universal (anyone can use it)
- T = Transverse (it means, on its side)
- M = Mercator (a map projection)
Here’s what UTM coordinates look like:
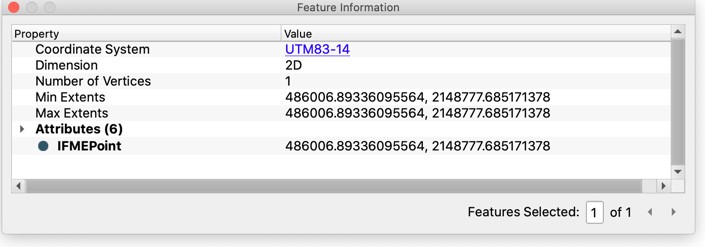
You can see they are quite different from LL coordinates (-99, 19 vs. 486006, 2148777). This is because the LL coordinates are expressed in decimal degrees while UTM coordinates are expressed in meters.
But, why might we use Mercator, especially when know that it distorts shape and size – like making Greenland as large as Africa?
It’s because it’s a good method to visualize the globe as a flat surface, which makes spatial analysis easier. UTM is actually a refined version of Mercator, so it doesn’t have the same problems. It splits the world into zones rather than treat it as a whole and the zones are taller than wide, hence “transverse”. Think of it like timezones, but for maps instead.
DEM/DTM/DSM
You’ll often hear one of these terms used in the context of spatial data (most often, DEM). DEM means digital elevation model. In short, it’s a representation of the ground surface. Look out of the window and imagine throwing a huge (really huge) sheet over that landscape. That sheet represents your elevation model:
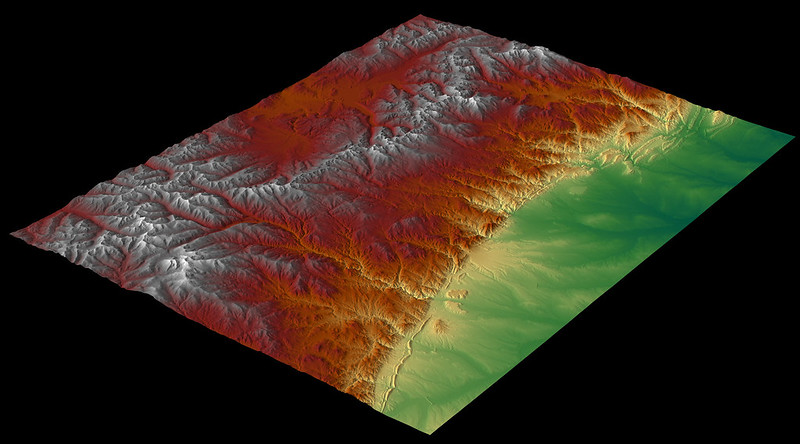
By Jesse Varner
When you threw the sheet over the landscape, did you picture it draped over trees and buildings, or with holes for them to pass through?
A sheet with holes that lets trees and buildings pass through is an elevation model (DEM). A sheet that clings to objects is a surface model (DSM). Added information about landforms makes it a terrain model (DTM).
Last But Not Least…
So that was a whirlwind tour through some of the more important spatial acronyms. Interestingly, several times I’ve mentioned FME, a data integration platform with a penchant for spatial. But, I haven’t explained what it means.
FME stands for feature manipulation engine. FME processes (manipulates) records (features) using a very powerful set of tools (engine). And it’s those powerful tools that make it so you can integrate, convert, validate, and transform data without having to code.
As the data integration platform with the best support for spatial data worldwide, FME was an essential addition to this list. It’s used in a variety of industries by thousands of customers.
If you’re interested in trying FME yourself to work on your own spatial projects, sign up for a free trial to get started.

Mark Ireland
Mark, aka iMark, is the FME Evangelist (est. 2004) and has a passion for FME Training. He likes being able to help people understand and use technology in new and interesting ways. One of his other passions is football (aka. Soccer). He likes both technology and soccer so much that he wrote an article about the two together! Who would’ve thought? (Answer: iMark)