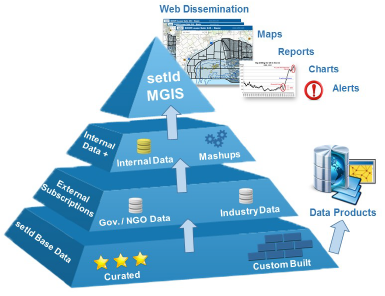
Let me introduce you to setld (scope, extract, transform, load, disseminate), an information solutions provider for the energy sector. Using FME, they turn data into business intelligence and serve it to their clients in the form of both traditional data products and their GIS-as-a-Service platform, Mentorprise GIS.
From the perspective of creating a business intelligence product for your organization or clients, there is an abundance of inspiration in what Jacob Maggard, FME Certified Professional, and the people at setld have accomplished with FME.
There is freely available data on the Internet that is challenging to take full advantage of, like news articles, open data portals and web services. I think most would cite the reason as lack of resources to sort through all the data and turn it into intelligence.

The problems with this type of data mirror that of the 4V’s of this IBM infographic on big data: volume, variety, velocity and veracity.
- Volume: There is so much of it. How do you identify what is relevant?
- Variety: The nature of this raw data is unstructured, disparate and disorganized. How do you normalize, blend and enrich it?
- Velocity: It is constantly changing – sometimes hourly. How do you make sure the data you’re working with is the freshest?
- Veracity: When important decisions are based on this data, how do you ensure it’s of the highest quality?
setld has employed FME to tackle these challenges and tame this wild data into intelligence, as well as implement tracking and validation systems to ensure their products are up to date and accurate.
Volume: Making Sense of the News
Most of us subscribe to news compilation services and can attest to feeling overwhelmed deciding based on headlines which articles are worth reading. The energy sector is no different and having timely, normalized and quantified news on competitors and/or investments can make a huge difference for decision makers.
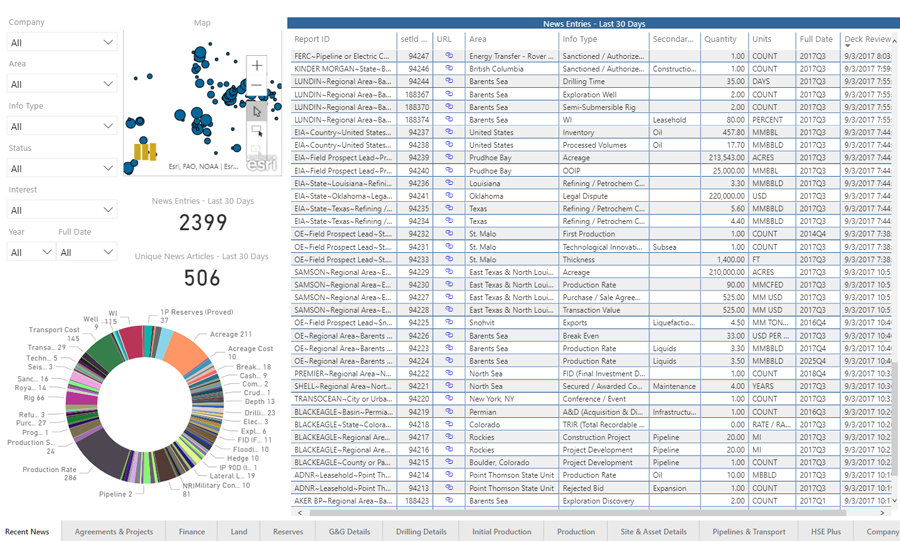
Recognizing this “volume” challenge, setld created their Energy Business Intelligence System (EBIS) data product, which presents news on 1500+ international oil and gas companies in a way such that customers can quickly determine which articles add value to their business. At the core of this system is FME, analyzing, ranking and enriching news from various sources including RSS feeds from 2800 Google Alerts, aggregated email newsletters, financial statements from the SEC, and investor presentations.
One way setld evaluates the relevance of a news piece is with its words. They developed a workflow that integrates with an .EXE that harvests words from PDFs of articles, releases, and presentations. FME indexes these words and adds fields for things like concatenated word prevalence lists, counts, ratios and totals. It then evaluates this revolving 40 million row word index table against a word value lookup table (that setld maintains) in order to rank the top 100 news pieces for processing each morning.
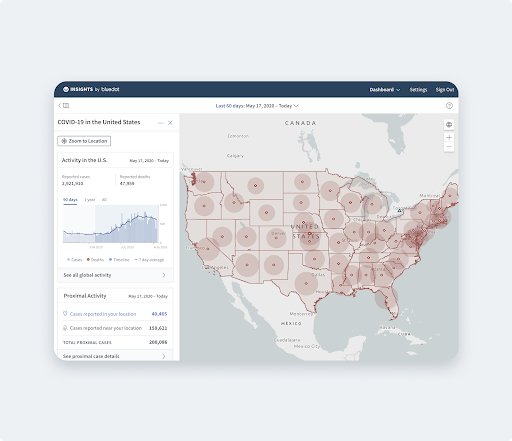
Another way FME is used to enrich sourced news is by adding a feature to each piece of information that represents the most granular location possible. With this added geospatial information, EBIS users can instantly access complete lists of information on the same metric – say drilling costs across a basin – for any hydrocarbon bearing zone on Earth. Without EBIS and FME, answering this question would require hours of Google searches and data modelling.
Variety: Turning Open Data into Useful Information
The majority of government organizations have free open data portals with files pertaining to their jurisdiction. But, as with most things in life, you get what you pay for, and more often than not this free data contains a limited amount of actionable information. It requires blending with other data – usually in disparate formats, sometimes from the same source – to get a useful picture of what is occurring.
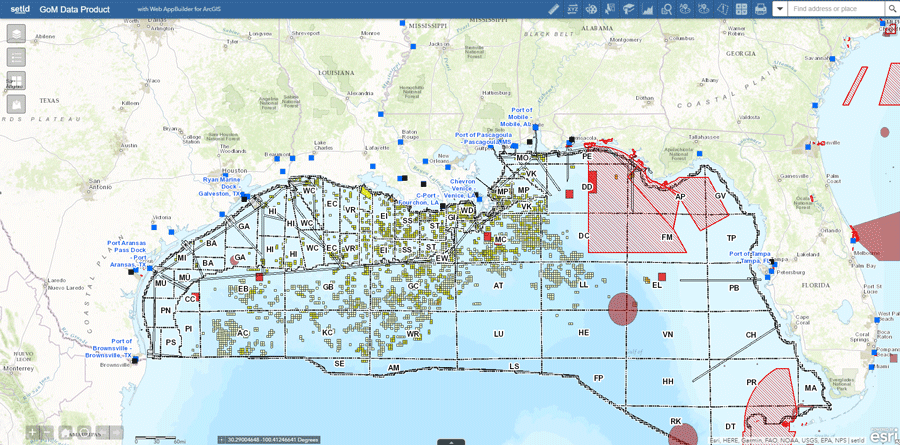
For the U.S. Gulf of Mexico (GoM) energy industry, one such data portal is made available by the Bureau of Ocean Energy Management (BOEM). It provides data on exploration and production (E&P) lease boundaries, terms, ownership, activity, production, HSE and more. Some of this data is consumable via web services or is provided as Shapefiles for ArcGIS, but almost none of it is usable in its standard form. For example there might be data on leases but it is missing crucial information like interests, or the data on production is not at the wellbore level – energy industry speak for “it is missing the information I really need”.
setld’s GoM data product solves this “variety” challenge by automatically harvesting BOEM open source data on a regular basis and using FME and its support for hundreds of different data formats to blend and augment it with the vital information it lacks. The data is then further bettered with FME’s tools that rank and add new classifications to the data, and ultimately preparing it for meaningful presentation to clients using both Microsoft Power B.I. and Esri ArcGIS Online.
Velocity & Veracity: Tracking Business Intelligence Workflows
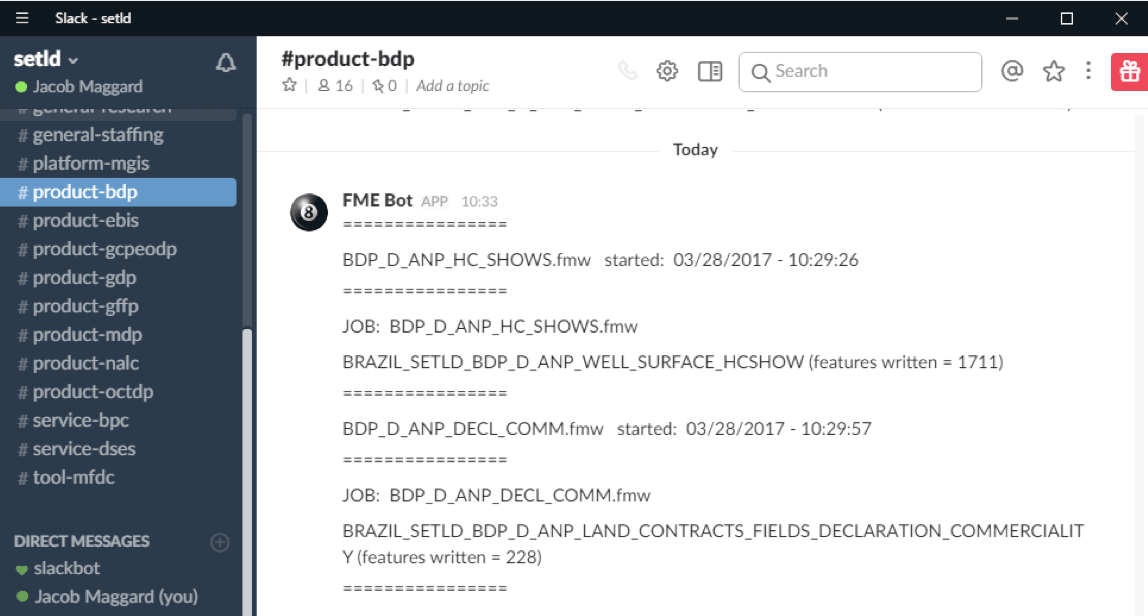
To address the “velocity” and “veracity” challenges of their data products, setld sets up its (hundreds of) FME workflows in such a way that they can easily track their status in terms of success, things that stand out, and time since it was last run. Each workflow has “end caps” that do three things:
- use FME’s SlackConnector to send summaries and error notifications to appropriate Slack channels that they can easily scan for issues;
- send summary emails highlighting key details to staff; and
- write to an Excel template that has conditional formatting that helps them identify data that is stale or has quality issues.
The result is a comprehensive tracking system that helps setld ensure that nothing slips through the cracks, and that their clients are getting a data product that is fresh and of the highest quality.
Rapidly Adjusting Workflows to Answer New Questions
FME’s flexibility is crucial to setld’s ability to deliver business intelligence products that meet their customers’ exact needs. As they learn more about the data they often see more information potential from adding a column with a new rank, classification or deductive relationship. These workflow iterations are done easily in FME, enabling them to quickly deliver new “answer modules” and displays to clients.
A Tip for Getting Started
I asked Jacob if he had any tips for individuals trying to set up business intelligence workflows. “Take time to organize a utilitarian flat file structure and database splits for managing your data,” he responded. “An established system for storing and naming files right at the start makes things so much easier as you move forward.”
Jacob’s team uses a flat file structure that directs data into 7 folders based on their function:
- Archive – a dump site for historics, unknowns and copies of files
- Admin – custom utilities and FME jobs that assist in product maintenance and prioritization
- Scope – a resting place for information on product purpose including links and files that are yet to be fully understood
- Extract – automated and manual data inputs waiting for transformation
- Transform – a place for FME jobs, logs and QC CSVs
- Load – distributable, packaged data copied from master databases after being transformed
- Disseminate – master data compilations, published to portals for access by clients
setld’s story is a great example of using FME to streamline the process of taking raw and disparate data from different sources on the web and turning it into world class information.

Riley Greene