 If you use Tableau, you know it’s a big deal in the Business Intelligence space. It’s a consistent Gartner leader and is a pleasure to use to visualize and analyze data.
We’re excited to announce FME’s support for Tableau and our technology partnership with them. And we think Tableau’s users will be excited too, as it means a ton of new ways to use the power of spatial data in Tableau!
See Also:
- Free tool for converting Shapefiles into Tableau Data Extract files
- Webinar Recording: How to Prep Mapping Data for Tableau (Become a Geographic Viz Wiz!)
- Blog: 6 Tableau Tasks You Didn’t Know You Could Do
- Blog: Importing Spatial Data into Tableau using FME
Tableau’s Geospatial Support: The Present & [Exciting] Future
While Tableau is a fantastic data visualization and analysis tool, its support for spatial has been slower to evolve. But that’s seemingly about to change, as it would appear that big improvements are in the works. First though, a quick overview of Tableau’s current spatial support:
✔ Basic geometry – points, lines/arcs, simple polygons/ellipses/donuts.
X No complex geometry – e.g. polygons with several holes.
X It’s tricky to represent more than a single type of geometry at a time. By default, multiple types will be drawn the same way. You can display multiple geometries (i.e. point on polygon) using inbuilt geographic roles or a custom geocoding database.
✔ WMS feeds.
✔ Mapbox integration for background maps. (Bonus: this can also be used to provide reference data and display multiple geometries, but they won’t be interactive.)
X Custom maps require more work. Create connection from Tableau Map Service (TMS) to Esri ArcGIS background maps or to Google Maps. [Quick tip: if you’re searching for WMS feeds to use, Spatineo has a nice directory indexing 40,709 spatial web services around the world.]
✔ New geometry field coming in 2016. At Tableau’s fall 2015 conference, they announced upcoming support for geospatial data files with a new Geometry field, as well as native support for Shapefiles. And the Tableau 10 beta gives the ability to create quick, custom geographic areas. All of these advancements are a big deal if you want to fully leverage the power of your organization’s mapping data in Tableau. We’ll have to wait and see what exactly is in store, but this should mean more sophisticated maps in Tableau.
Getting Spatial Data into Tableau with FME
Your GIS department is a treasure trove of useful maps and geospatial data. But it’s much more than just a new source of data to use in isolation within Tableau.
The real magic is when spatial information and business data come together, mashing up multiple sources of data and enriching them to see the locational context of things previously spread across data silos or stuck languishing away in some database table or CSV file.
As of FME 2016.1 you can write data in hundreds of FME’s supported formats to Tableau’s TDE (Tableau Data Extract) format. FME’s specialty is complex spatial data so this new support really opens the floodgates for Tableau users to make use of the full range of spatial data. Plus you can integrate tabular data in most any format, and geometries derived from CAD, BIM, LiDAR files, and much more.
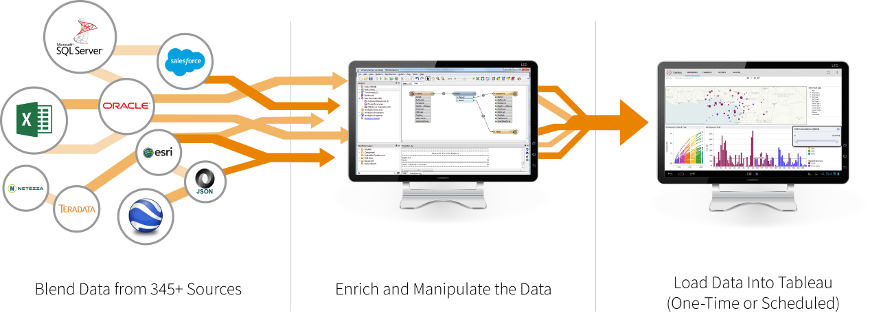
To get your data into Tableau, simply open an FME workspace, add a reader for your existing data, link together transformers as needed, and write the data out to a Tableau TDE file. (No need to write to an intermediate CSV file as FME provides direct support for TDE.) The next time, just click the Run button – optionally change your input – and let everything happen automatically.
Example # 1 – Bringing GIS, CAD, BIM and Tableau Together at UMass Amherst
University of Massachusetts Amherst has 28,000+ students and 6,000+ employees on a 1,450 acre campus that contains 200+ major buildings. As you can imagine, enabling campus-wide analytics means bringing together a lot of data. Historically that meant data in CAD, GIS, and BIM. Lately, they’ve added Tableau to the mix – and FME’s helping there too.
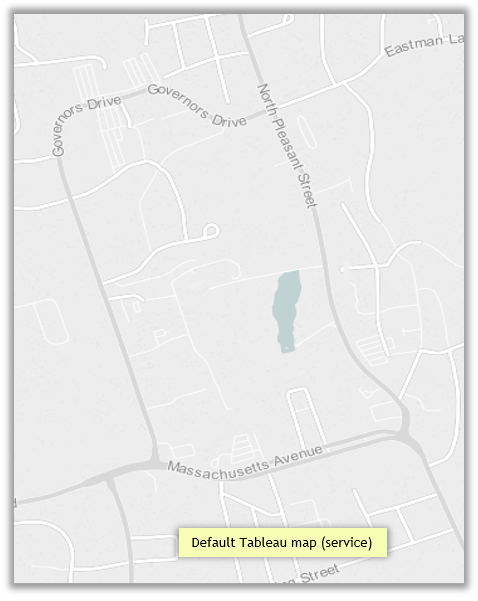
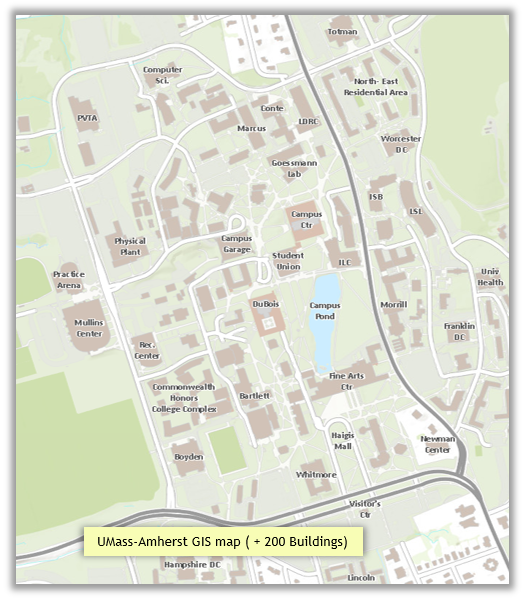
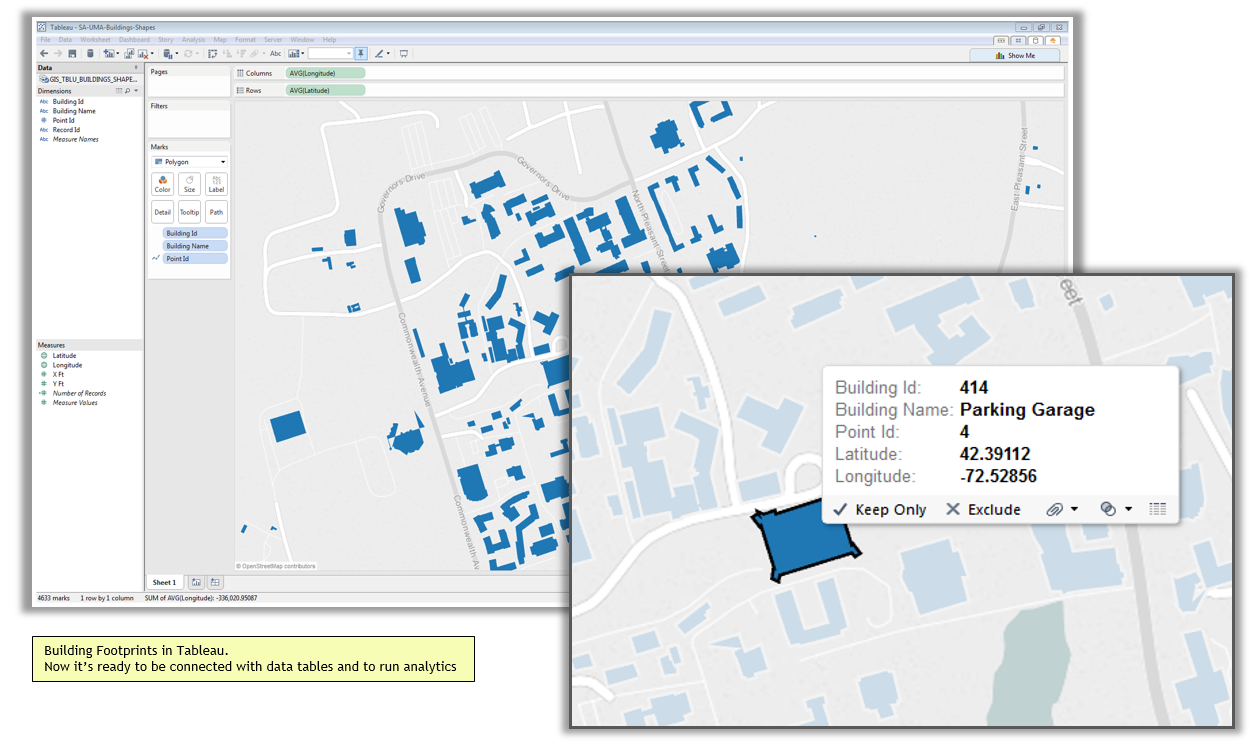
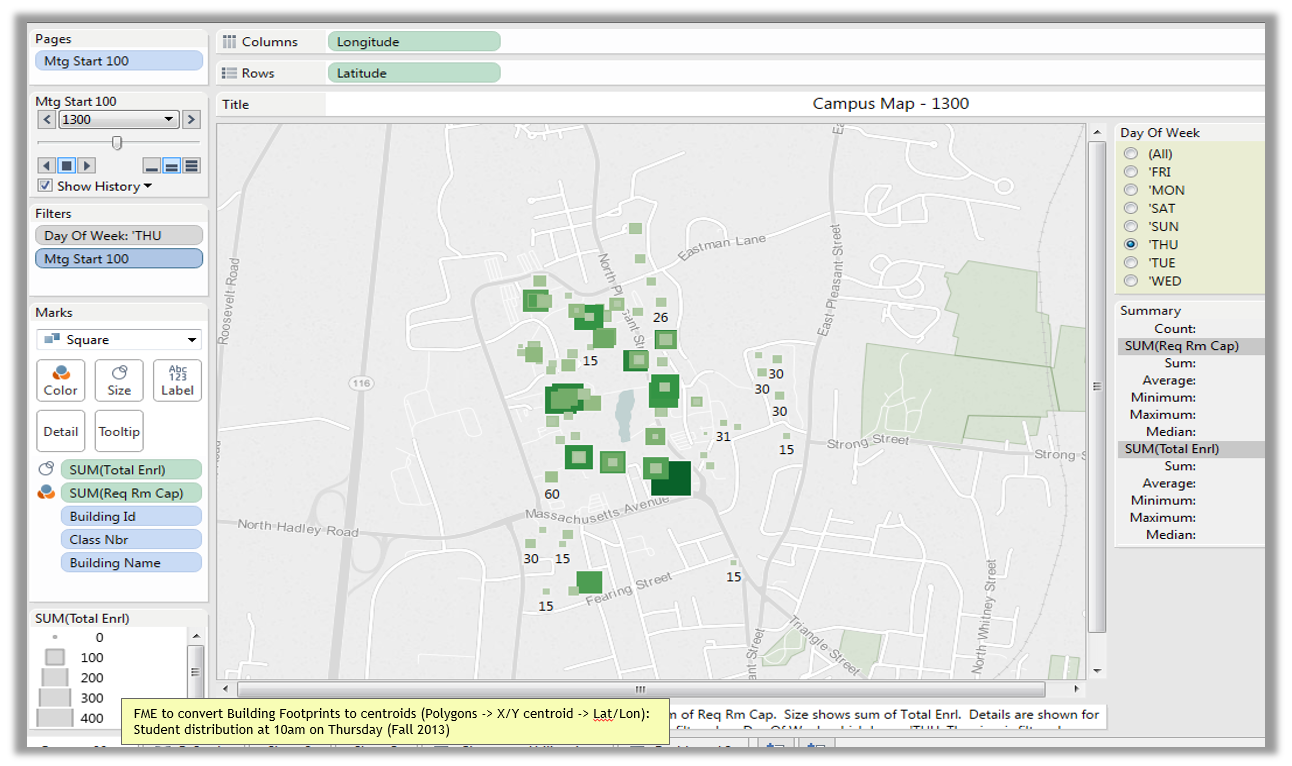
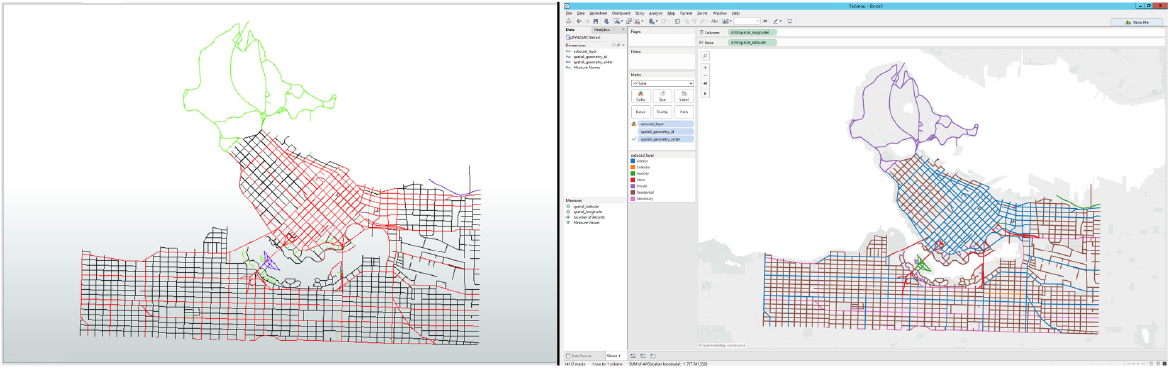
They wanted to do things like visualize class enrolment per room at any particular time of the day. Unfortunately, the default Tableau map was the one on the left. Not much analysis going to happen there. But they had a detail-rich map in Esri ArcGIS (right) that covered their entire campus. Buildings, spaces, infrastructure, and more were all accurately mapped with attribution providing additional information.
Floor Plans + Space Inventory
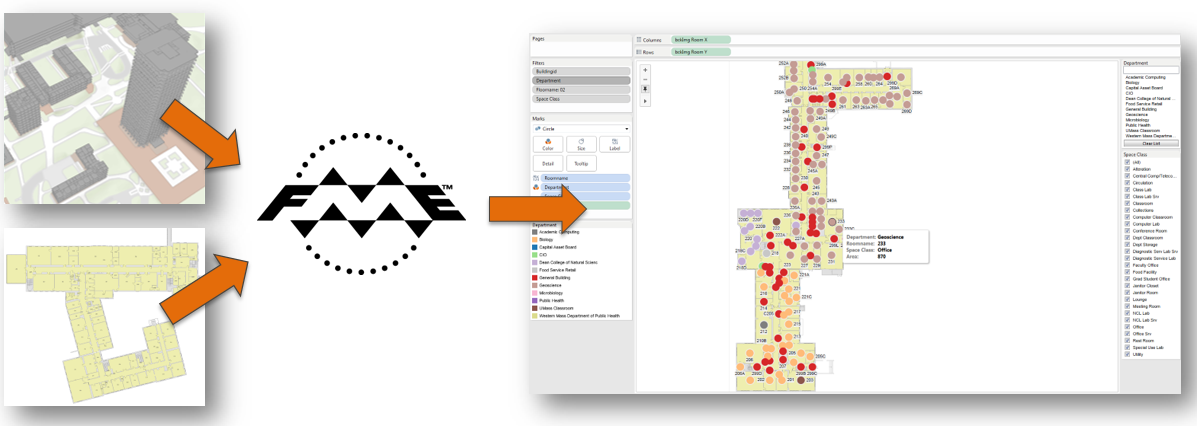
Next they rasterized the vector floorplan data using FME and loaded it into Tableau as a Background Image. FME was then used to define the extents/boundaries, make centroids for the rooms, and create the room polygons. And the results looked like this. Impressive! (Kudos to Alexander Stepanov, Niels la Cour, and their whole team.)
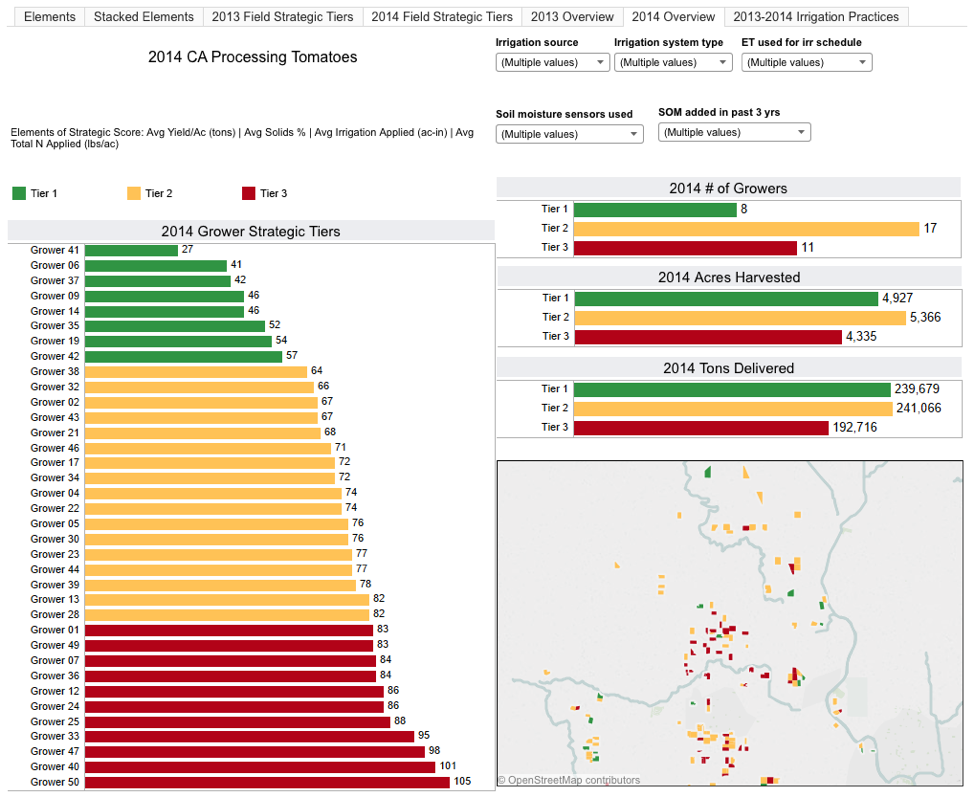
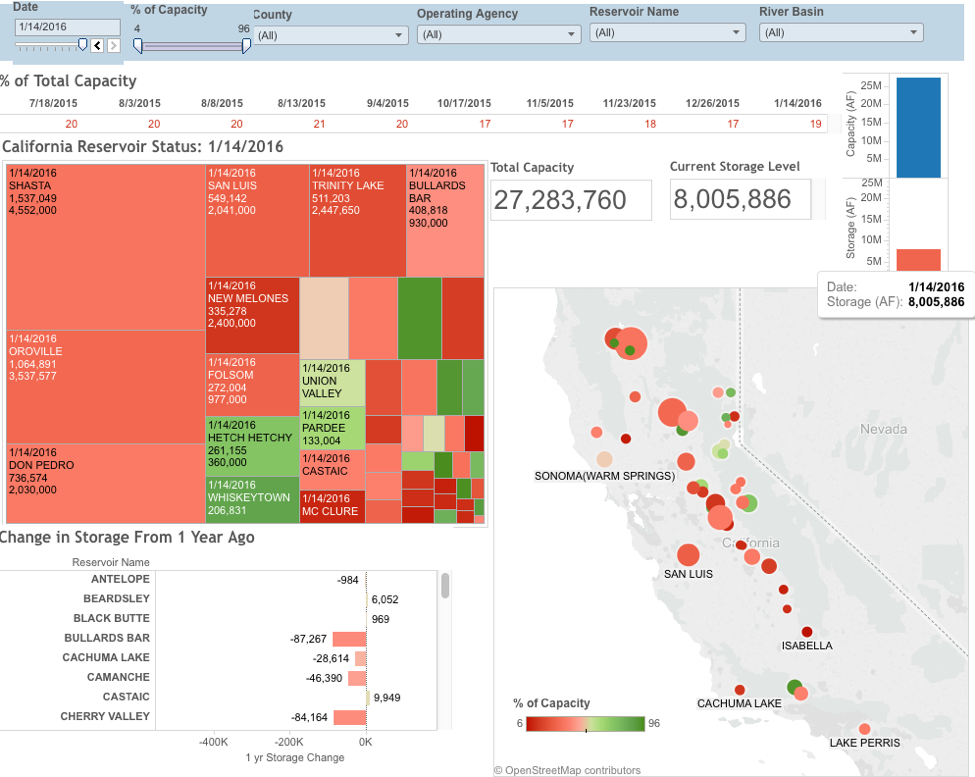
Example # 2 – Using Data to Manage Supply Chain Risk at Athena Intelligence
 Athena Intelligence provides dynamic business intelligence to the food supply network and associated stakeholders. This includes everything from food production, processing and manufacturing companies to environmental groups, grocery chains and financial institutions. They take a staggering amount of natural resource data and combine it with information from their customers’ supply chain and processing facilities – providing real, up-to-date, and actionable data which helps their customers identify opportunities and manage risks within their supply chain.
The data originates in literally hundreds of disaggregated sources and exists in dozens of formats ranging from Esri Shapefile, KML, GeoTIFF, CSV, Excel, File Cabinets, and Individuals. Using simple surveys and spreadsheets wasn’t going to cut it.
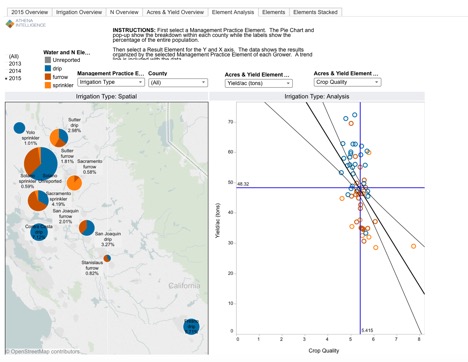
So they used Tableau to provide an interactive view into the data. Customers can easily poke around to assess variables like surface water and groundwater availability, crop quality, producer performance, and harvest yields. Equipped with this valuable information, they can identify and retain top producers, secure valuable assets first, and take steps to head off possible risks.
The problem was, there was a lot of data. And it wasn’t just as simple as uploading it all into Tableau.
So they used FME to massage the data; get all of the kinks worked out, and then import into Tableau. And it works! As David Sypnieski at Athena once commented to us:
![]() “Tableau makes data beautiful, FME gets data to the point where it can be made beautiful.”
“Tableau makes data beautiful, FME gets data to the point where it can be made beautiful.”
They next plan to add FME Cloud to the mix, to automate the data loading process on a scheduled basis.
Curious what Athena’s information looks like in Tableau? Take a look at their demo site.
Example # 3 – Data Processing and Automation for Tableau at Dotted Eyes
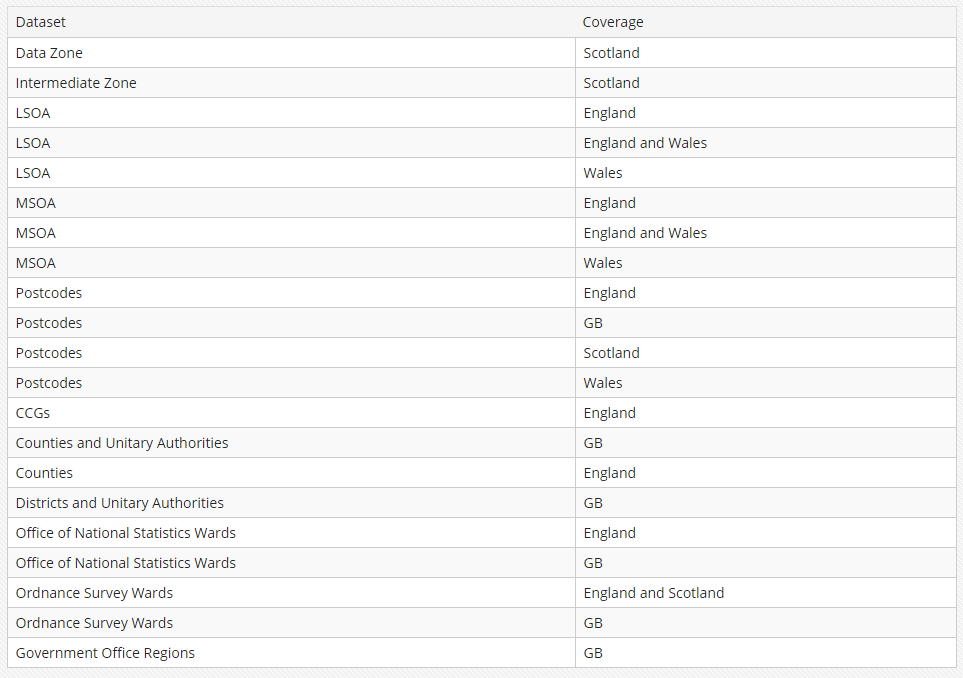
List of reference geographies available on the Dotted Eyes portal.
Dotted Eyes is based in the UK and has been a partner of both Tableau and Safe for many years now. Even prior to the TDE writer, they were already using FME with Tableau in their consultancy projects for standard transformation through to data enrichment; blending multiple data sources to aid complex spatial analysis.
They also provide a number of popular UK boundary reference geographies for use in Tableau via a data download portal. Initially, providing that data was very much a hand-crafted exercise. At least it was until they started using FME to help with a number of pre-processing steps including generalization and reprojection.
And they’re excited about how the TDE writer will aid automation. Jarek Sobanski of Dotted Eyes tells us:
![]() “I think the new TDE writer will make a big difference for people. It will allow data to be extracted more regularly and the process to be more automated. This will be more applicable to business datasets which are frequently changed as opposed to static references boundaries.”
“I think the new TDE writer will make a big difference for people. It will allow data to be extracted more regularly and the process to be more automated. This will be more applicable to business datasets which are frequently changed as opposed to static references boundaries.”
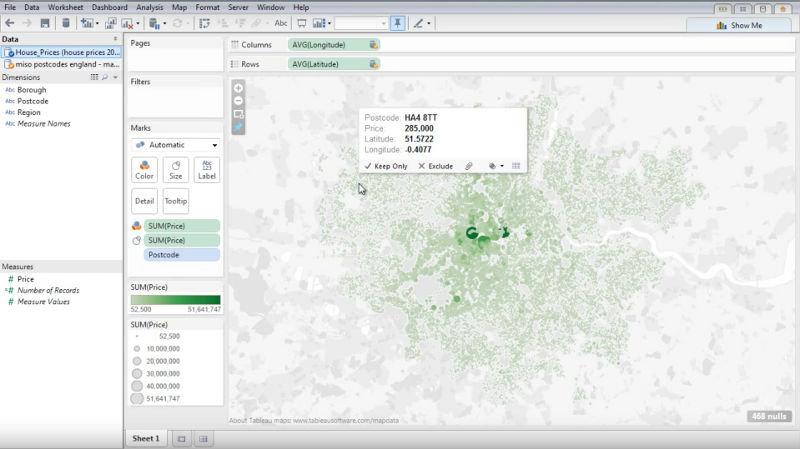
Postal code boundaries from Dotted Eyes’ portal being used in Tableau.
Here’s a quick rundown of how FME can help Tableau users
- Import spatial data from hundreds of FME supported file formats and applications into Tableau. Load one file, or combine data from multiple sources – it’s all the same to FME.
- Manipulate complex data into something usable for analysis in Tableau, with over 450 FME transformers at your fingertips.
- Reproject data to Tableau’s preferred Web Mercator / WGS84 from over 5,000 coordinate systems – FME offers several reprojection engines, including CS-MAP, Esri, Blue Marble, and Gtrans — or you can use your own custom coordinate system!
- Generalize data and simplify features – e.g. removing extra vertices from a line.
- Extract coordinates in latitude and longitude and plot marks in Tableau.
- Perform spatial analysis and show your results directly in Tableau – e.g. spatial heatmaps, proximity analysis, routing, etc.
- Clean data prior to loading into Tableau.
- Use FME to style any background map you want to use in Tableau, e.g. use the MapboxStyler transformer to enhance your Mapbox background map.
- Automate any or all of the above processes.
| Before: Road Network data stuck in an AutoCAD DWG file. |
After: Data loaded into Tableau in minutes with FME Desktop. |
Conclusion
Tableau is an incredible tool for data visualization and analytics. FME is fantastic at integrating data and making automated workflows with no coding required – and it’s the best tool for transforming complex spatial data. Used together, you can access data from hundreds of GIS, CAD, BIM, and other formats in Tableau, and save a ton of time. And with more information at your fingertips, you can make better and more informed decisions.
If you’re already using FME, download FME 2016.1 and refer to the TDE writer documentation for details.
If you want to give FME a try, you can download a free 30-day trial of FME Desktop.
I’d love to hear how you might use Tableau and FME together. If you have questions about using FME’s new Tableau support, please comment below or use our live chat to speak with our friendly support team.

Roger Aikema